CovidContagionGridVisual
This example builds upon covid_contagion_grid by adding a Visualizer.
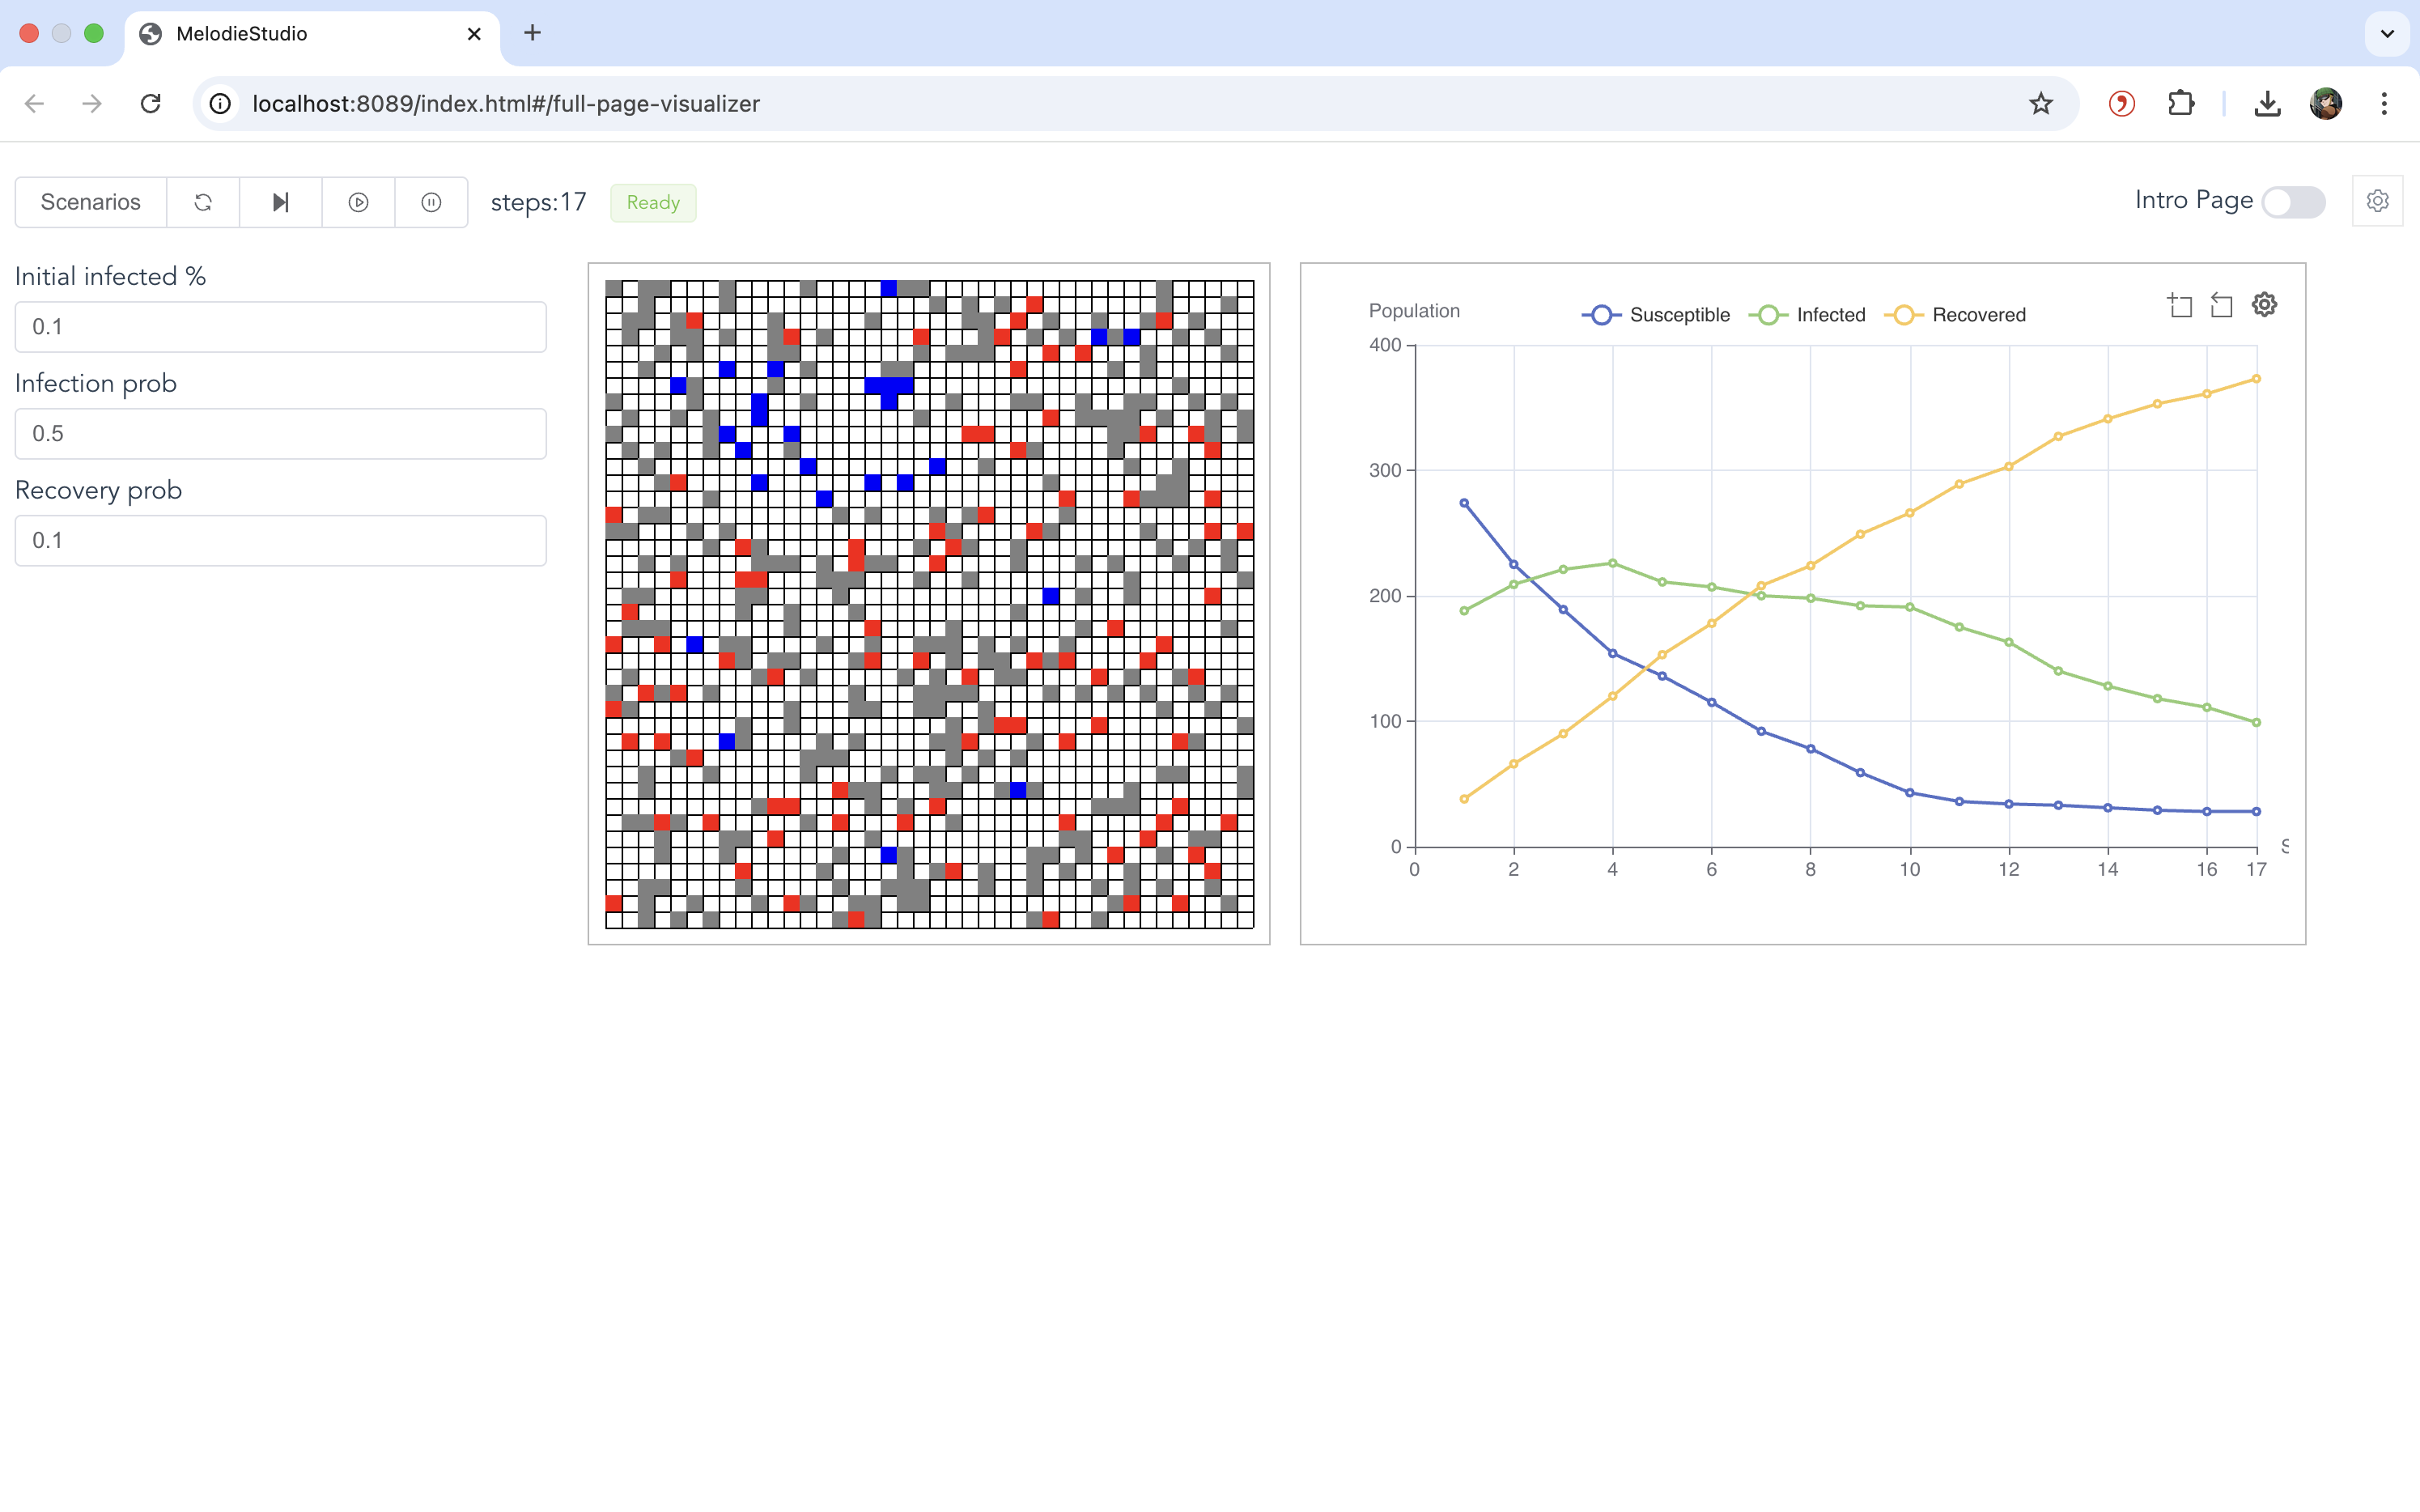
It demonstrates how to use MelodieStudio to interactively run the simulation and view real-time animations of the grid and data charts.
Visualizer: Project Structure
The structure is similar to the grid example but adds a visualizer component:
examples/covid_contagion_grid_visual
├── core/
│   ├── agent.py
│   ├── grid.py
│   ├── environment.py
│   ├── model.py
│   ├── scenario.py
│   ├── visualizer.py       # Defines charts and grid styling
│   └── ...
├── data/
│   └── ...
├── run_studio.py           # Launches MelodieStudio
└── run_simulator.py         # Runs headless simulation
Visualizer: Key Changes
Visualizer Class: A new class
CovidVisualizerinherits fromMelodie.Visualizer. It defines:Charts: A line chart tracking the number of Susceptible, Infected, and Recovered agents.
Grid View: A visual representation of the grid where agents appear as colored dots (Green=Susceptible, Red=Infected, Gray=Recovered).
MelodieStudio: Instead of running a batch simulation immediately, the
run_studio.pyscript starts a local web server (MelodieStudio). You can control the simulation (Start, Pause, Reset) from the browser.
Visualizer: Running the Model
To run the model with the visualizer, execute the main script:
python -m examples.covid_contagion_grid_visual.run_studio
Then, open your browser and navigate to http://localhost:8089. This is the web gateway for MelodieStudio. The backend simulation service will automatically run on 127.0.0.1:8765.
In the web interface, go to the Simulator page.
The interactive parameter controls will appear on the left. You can adjust them and click Reset to apply the new values.
Click Start to begin the simulation.
The grid animation will be displayed in the center, and the line chart showing health state trends will be on the right.
Visualizer: Customization Guide
Here’s how you can customize the visualizer components:
1. Adding Data Charts (e.g., Line Chart)
In
core/visualizer.py, useself.plot_charts.add_line_chart("unique_chart_name")to create a new chart.Chain it with
.set_data_source({...})to bind data series. The values of the dictionary should be functions that return the numerical data for each time step (e.g.,self.model.environment.num_susceptible).You can add multiple charts (line, pie, bar) as long as each has a unique name.
2. Configuring the Grid View
Use
self.add_grid(...)to link the visualizer to your model’sGridobject.The
var_styledictionary is key: it maps the integer values returned byvar_getterto a specific color and a label for the legend.The legend for the grid is automatically generated based on these labels.
3. Adding an Interactive Parameter Panel
Use
self.params_manager.add_param(...)to register interactive parameters. The example adds threeFloatParaminstances for:initial_infected_percentageinfection_probrecovery_prob
Each parameter requires a
getterto read its current value from theScenarioand asetterto write the new value from the web UI back to theScenario.After changing a parameter in the UI, click the Reset button to restart the simulation with the new settings.
4. Adjusting the Layout
The layout is controlled by
.melodie/studio/chart_layout.json. Each key in the JSON object corresponds to a component on the page:"controls": The parameter panel on the left."visualizer-grid": The grid animation component."chart-health_state_trend": The line chart (the name must match the one defined inadd_line_chart).
You can adjust the position and size of each component using pixel values for
left,top,width, andheight. Changes take effect after restarting the server.
5. Styling Charts
You can provide additional ECharts options in
.melodie/studio/chart_options.json.The key must match the chart’s name (e.g.,
"health_state_trend").In the example, this is used to enable the legend, add axis titles, and adjust the chart’s internal grid margins for better spacing.
Visualizer: Code
This section shows the key code additions for the visualizer. Core logic files are the same as the covid_contagion_grid example.
Visualizer Definition
This file is the core addition. It maps model data to visual elements. Defined in core/visualizer.py.
 1from Melodie import Visualizer
 2from .model import CovidModel
 3from MelodieInfra.lowcode.params import FloatParam
 4
 5
 6class CovidVisualizer(Visualizer):
 7    model: CovidModel
 8
 9    def set_model(self, model: CovidModel):
10        """
11        Called when the visualizer is bound to a model instance.
12        Set grid dimensions here (model is available now).
13        """
14        super().set_model(model)
15        # Ensure grid dimensions are passed to frontend for correct scaling
16        self.width = model.grid.width()
17        self.height = model.grid.height()
18
19    def setup(self):
20        # Add interactive parameters to the left control panel
21        self.params_manager.add_param(
22            FloatParam(
23                name="initial_infected_percentage",
24                value_range=(0.0, 1.0),
25                step=0.01,
26                getter=lambda scenario: scenario.initial_infected_percentage,
27                setter=lambda scenario, val: setattr(
28                    scenario, "initial_infected_percentage", val
29                ),
30                label="Initial infected %",
31                description="Share of agents initially infected (0-1).",
32            )
33        )
34        self.params_manager.add_param(
35            FloatParam(
36                name="infection_prob",
37                value_range=(0.0, 1.0),
38                step=0.01,
39                getter=lambda scenario: scenario.infection_prob,
40                setter=lambda scenario, val: setattr(
41                    scenario, "infection_prob", val
42                ),
43                label="Infection prob",
44                description="Probability an infected agent infects a neighbor each step.",
45            )
46        )
47        self.params_manager.add_param(
48            FloatParam(
49                name="recovery_prob",
50                value_range=(0.0, 1.0),
51                step=0.01,
52                getter=lambda scenario: scenario.recovery_prob,
53                setter=lambda scenario, val: setattr(
54                    scenario, "recovery_prob", val
55                ),
56                label="Recovery prob",
57                description="Probability an infected agent recovers each step.",
58            )
59        )
60
61        # Configure the chart to show population health states over time
62        self.plot_charts.add_line_chart("health_state_trend") \
63            .set_data_source({
64                "Susceptible": lambda: self.model.environment.num_susceptible,
65                "Infected": lambda: self.model.environment.num_infected,
66                "Recovered": lambda: self.model.environment.num_recovered
67            })
68
69        # Configure the grid visualization
70        self.add_grid(
71            name="covid_grid",
72            grid_getter=lambda: self.model.grid,
73            var_getter=lambda agent: agent.health_state,
74            var_style={
75                0: {"label": "Susceptible", "color": "#0000FF"},
76                1: {"label": "Infected", "color": "#FF0000"},
77                2: {"label": "Recovered", "color": "#808080"}
78            },
79            update_spots=False
80        )
Model Structure
Same as the grid example. Defined in core/model.py.
 1from typing import TYPE_CHECKING
 2
 3from Melodie import Model
 4
 5from .agent import CovidAgent
 6from .data_collector import CovidDataCollector
 7from .environment import CovidEnvironment
 8from .grid import CovidGrid, CovidSpot
 9from .scenario import CovidScenario
10
11if TYPE_CHECKING:
12    from Melodie import AgentList
13
14
15class CovidModel(Model):
16    """
17    The Model class assembles all components: agents, environment, grid, and data collector.
18    """
19
20    scenario: "CovidScenario"
21    agents: "AgentList[CovidAgent]"
22    environment: CovidEnvironment
23    data_collector: CovidDataCollector
24    grid: CovidGrid
25
26    def create(self) -> None:
27        """
28        Create component instances.
29        """
30        self.agents = self.create_agent_list(CovidAgent)
31        self.environment = self.create_environment(CovidEnvironment)
32        self.data_collector = self.create_data_collector(CovidDataCollector)
33        self.grid = self.create_grid(CovidGrid, CovidSpot)
34
35    def setup(self) -> None:
36        """
37        Setup the model components.
38        """
39        # 1. Initialize agents based on scenario parameter
40        self.agents.setup_agents(self.scenario.agent_num)
41
42        # 2. Setup grid dimensions and apply properties (like stay_prob)
43        self.grid.setup_params(width=self.scenario.grid_x_size, height=self.scenario.grid_y_size)
44
45        # 3. Place agents randomly on the grid
46        self.grid.setup_agent_locations(self.agents, "random_single")
47
48        # 4. Seed initial infections
49        self.environment.seed_infection(self.agents)
50
51    def run(self) -> None:
52        """
53        The main simulation loop.
54        """
55        for t in self.iterator(self.scenario.period_num):
56            self.environment.agents_move(self.agents)
57            self.environment.agents_infect(self.agents)
58            self.environment.agents_recover(self.agents)
59            self.environment.update_population_stats(self.agents)
60            self.data_collector.collect(t)
61        self.data_collector.save()
Environment Logic
Same as the grid example. Defined in core/environment.py.
 1import random
 2from typing import TYPE_CHECKING
 3
 4from Melodie import Environment
 5
 6if TYPE_CHECKING:
 7    from Melodie import AgentList
 8    from .agent import CovidAgent
 9    from .scenario import CovidScenario
10
11
12class CovidEnvironment(Environment):
13    """
14    The environment class orchestrates the simulation steps and manages macro-level logic.
15    """
16
17    scenario: "CovidScenario"
18
19    def setup(self) -> None:
20        """
21        Initialize macro-level counters for statistics.
22        """
23        self.num_susceptible: int = 0
24        self.num_infected: int = 0
25        self.num_recovered: int = 0
26
27    def agents_move(self, agents: "AgentList[CovidAgent]") -> None:
28        """
29        1. Agents move.
30        """
31        for agent in agents:
32            agent.move()
33
34    def agents_infect(self, agents: "AgentList[CovidAgent]") -> None:
35        """
36        2. Infected agents spread the virus.
37        """
38        for agent in agents:
39            agent.infect_neighbors(agents)
40
41    def agents_recover(self, agents: "AgentList[CovidAgent]") -> None:
42        """
43        3. Infected agents try to recover.
44        """
45        for agent in agents:
46            agent.recover()
47
48    def seed_infection(self, agents: "AgentList[CovidAgent]") -> None:
49        """
50        Infect a percentage of agents at the start of the simulation.
51        """
52        for agent in agents:
53            if random.random() < self.scenario.initial_infected_percentage:
54                agent.health_state = 1
55
56    def update_population_stats(self, agents: "AgentList[CovidAgent]") -> None:
57        """
58        Count the number of agents in each health state.
59        """
60        self.num_susceptible = 0
61        self.num_infected = 0
62        self.num_recovered = 0
63        for agent in agents:
64            if agent.health_state == 0:
65                self.num_susceptible += 1
66            elif agent.health_state == 1:
67                self.num_infected += 1
68            elif agent.health_state == 2:
69                self.num_recovered += 1
Agent Behavior
Same as the grid example. Defined in core/agent.py.
 1import random
 2from typing import TYPE_CHECKING
 3
 4from Melodie import GridAgent
 5
 6if TYPE_CHECKING:
 7    from .grid import CovidGrid, CovidSpot
 8    from .scenario import CovidScenario
 9    from Melodie import AgentList
10
11
12class CovidAgent(GridAgent):
13    """
14    An agent capable of moving on a grid and spreading infection to neighbors.
15    Inherits from GridAgent to gain spatial attributes (x, y) and methods.
16    """
17
18    scenario: "CovidScenario"
19    grid: "CovidGrid"
20    spot: "CovidSpot"
21
22    def set_category(self) -> None:
23        """
24        Set the category of the agent.
25        Melodie uses this to manage different groups of agents.
26        """
27        self.category = 0
28
29    def setup(self) -> None:
30        """
31        Initialize agent attributes.
32        """
33        self.x: int = 0
34        self.y: int = 0
35        # Health state: 0 = Susceptible, 1 = Infected, 2 = Recovered
36        self.health_state: int = 0
37
38    def move(self) -> None:
39        """
40        Move the agent based on the property of the current spot.
41        The agent has a probability (1 - stay_prob) to move to a random neighboring cell.
42        """
43        current_spot = self.grid.get_spot(self.x, self.y)
44        if random.random() > current_spot.stay_prob:
45            # Move randomly within a radius of 1 cell (Moore neighborhood)
46            self.rand_move_agent(x_range=1, y_range=1)
47
48    def infect_neighbors(self, agents: "AgentList[CovidAgent]") -> None:
49        """
50        If infected, try to infect susceptible neighbors.
51        """
52        if self.health_state != 1:
53            return
54
55        # Get neighbors within a radius of 1
56        neighbors = self.grid.get_neighbors(self, radius=1)
57
58        for neighbor_id in neighbors:
59            # In Melodie, get_neighbors returns a list of agent IDs (or objects depending on config).
60            # Here we assume it returns IDs or we access the agent list directly.
61            # Actually, standard Grid.get_neighbors returns list of (agent_category, agent_id).
62            category, agent_id = neighbor_id
63            neighbor: "CovidAgent" = agents.get_agent(agent_id)
64
65            if neighbor.health_state == 0:
66                if random.random() < self.scenario.infection_prob:
67                    neighbor.health_state = 1
68
69    def recover(self) -> None:
70        """
71        If infected, there is a chance to recover.
72        """
73        if self.health_state == 1 and random.random() < self.scenario.recovery_prob:
74            self.health_state = 2
Grid Definition
Same as the grid example. Defined in core/grid.py.
 1from Melodie import Grid, Spot
 2from typing import TYPE_CHECKING
 3
 4if TYPE_CHECKING:
 5    from .scenario import CovidScenario
 6
 7
 8class CovidSpot(Spot):
 9    """
10    Represents a single cell on the grid.
11    Can hold properties that affect agent behavior, like 'stay_prob'.
12    """
13
14    def setup(self) -> None:
15        self.stay_prob: float = 0.0
16
17
18class CovidGrid(Grid):
19    """
20    Manages the 2D space, spots, and agent positions.
21    """
22
23    scenario: "CovidScenario"
24
25    def setup(self) -> None:
26        """
27        Configure the grid.
28        Here we apply the 'stay_prob' matrix loaded in the scenario to the spots.
29        """
30        # set_spot_property loads a 2D numpy array or list of lists into the grid spots
31        self.set_spot_property("stay_prob", self.scenario.stay_prob_matrix)