CovidContagionNetworkVisual
This example builds upon covid_contagion_network by adding a Visualizer.
It demonstrates how to use MelodieStudio to interactively run the simulation and view real-time animations of the network topology and data charts.
Visualizer: Project Structure
The structure is similar to the network example but adds a visualizer component:
examples/covid_contagion_network_visual
├── core/
│   ├── agent.py
│   ├── environment.py
│   ├── model.py
│   ├── scenario.py
│   ├── data_collector.py
│   ├── visualizer.py       # Defines charts and network styling
│   └── ...
├── data/
│   └── ...
├── run_studio.py           # Launches MelodieStudio
└── run_simulator.py        # Runs headless simulation
Visualizer: Key Changes
Visualizer Class: A new class
CovidVisualizerinherits fromMelodie.Visualizer. It defines:Charts: A line chart tracking the number of Susceptible, Infected, and Recovered agents.
Network View: A visual representation of the network where agents appear as colored nodes (Blue=Susceptible, Red=Infected, Gray=Recovered) connected by edges.
MelodieStudio: Instead of running a batch simulation immediately, the
run_studio.pyscript starts a local web server (MelodieStudio). You can control the simulation (Start, Pause, Reset) from the browser.
Visualizer: Running the Model
To run the model with the visualizer, execute the main script:
python -m examples.covid_contagion_network_visual.run_studio
Then, open your browser and navigate to http://localhost:8089. This is the web gateway for MelodieStudio. The backend simulation service will automatically run on 127.0.0.1:8765.
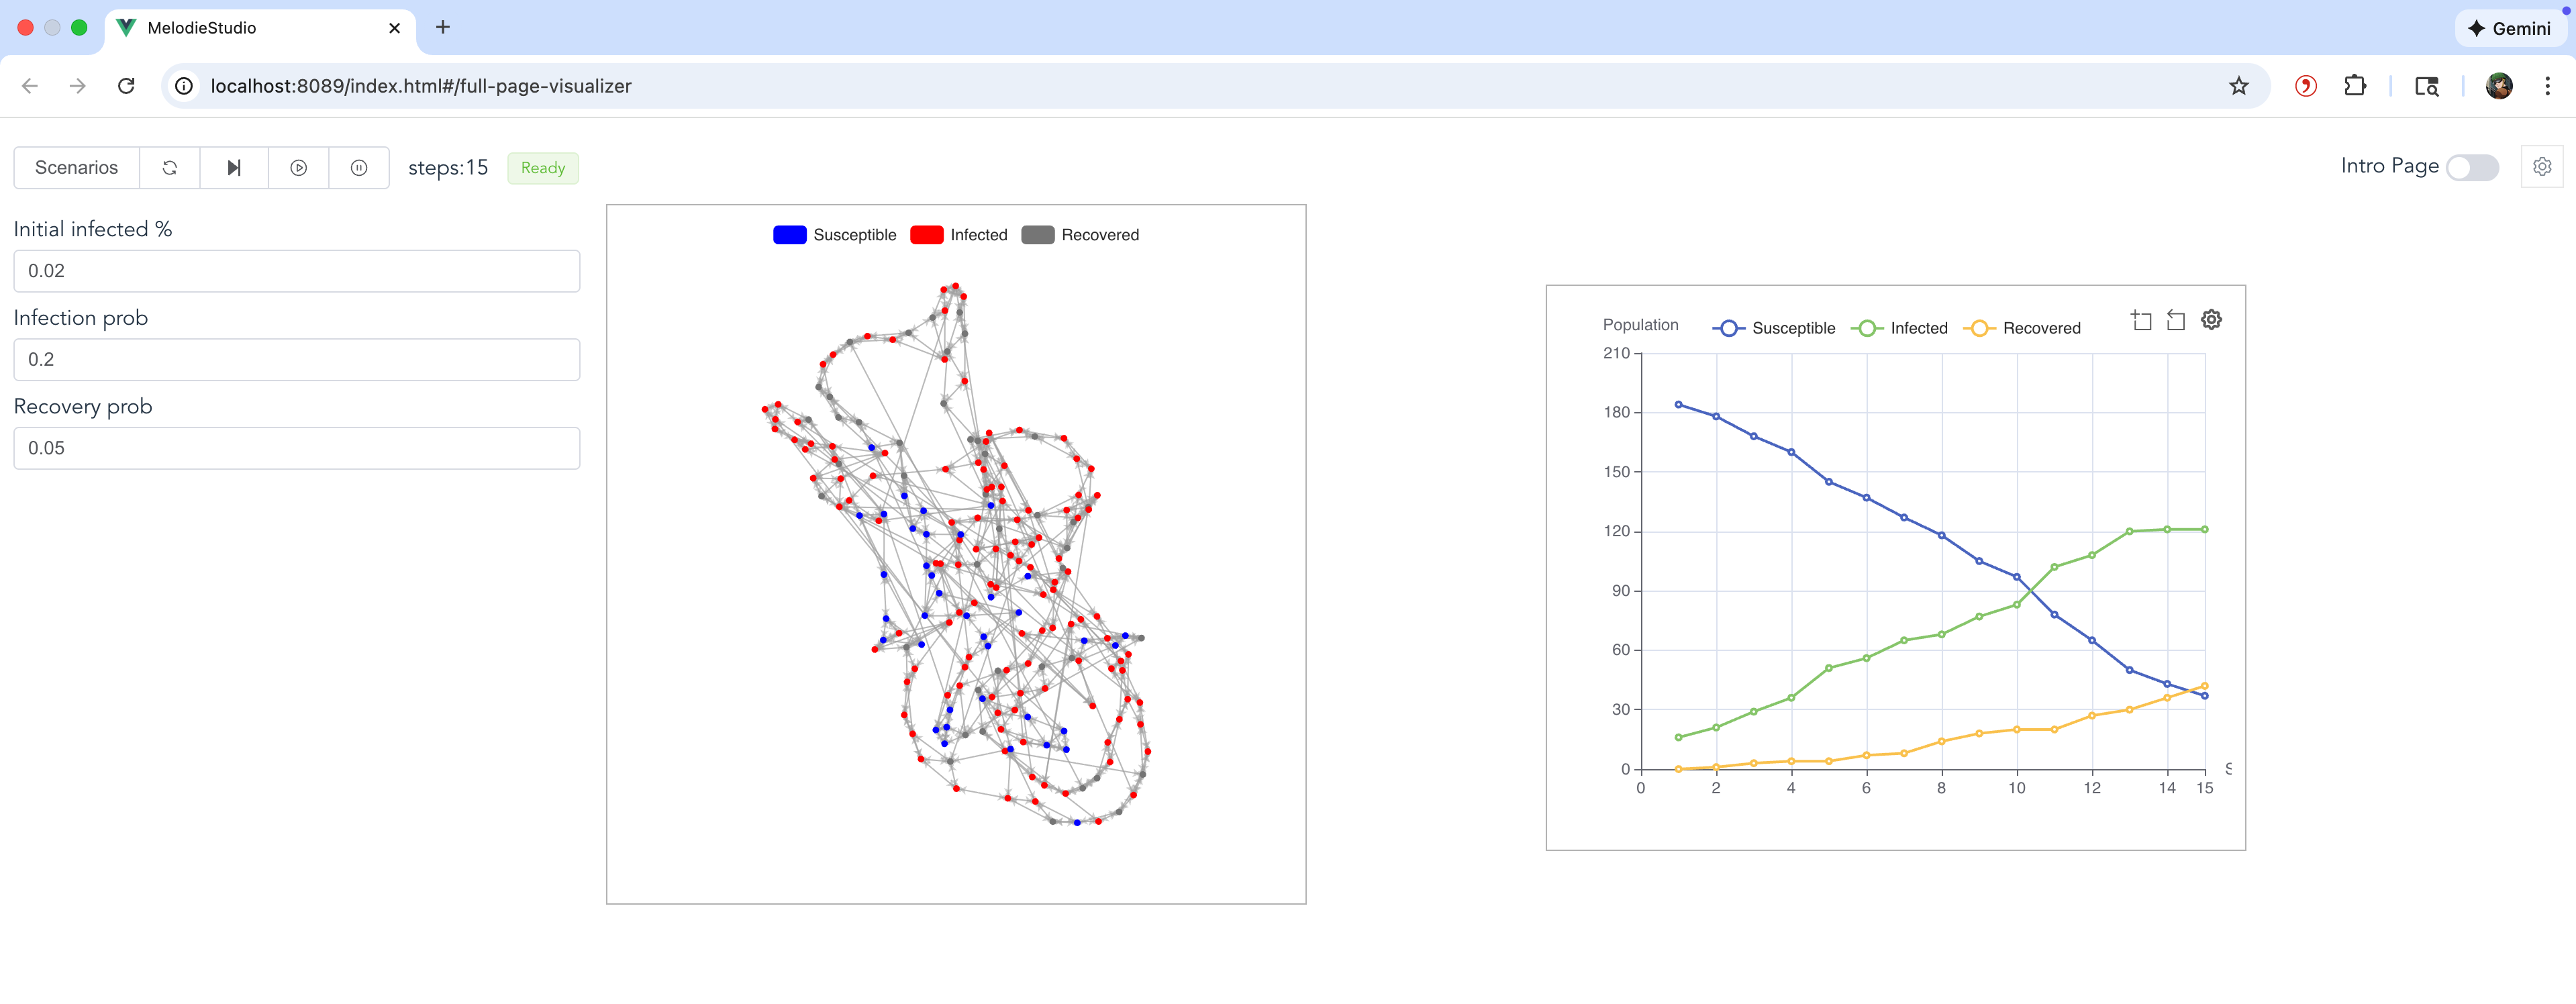
In the web interface, go to the Simulator page.
The interactive parameter controls will appear on the left. You can adjust them and click Reset to apply the new values.
Click Start to begin the simulation.
The network animation will be displayed in the center, and the line chart showing health state trends will be on the right.
Visualizer: Customization Guide
Here’s how you can customize the visualizer components:
1. Adding Data Charts (e.g., Line Chart)
In
core/visualizer.py, useself.plot_charts.add_line_chart("unique_chart_name")to create a new chart.Chain it with
.set_data_source({...})to bind data series. The values of the dictionary should be functions that return the numerical data for each time step (e.g.,self.model.environment.num_susceptible).You can add multiple charts (line, pie, bar) as long as each has a unique name.
2. Configuring the Network View
Use
self.add_network(...)to link the visualizer to your model’sNetworkobject.The
var_styledictionary is key: it maps the integer values returned byvar_getterto a specific color and a label for the legend.The legend for the network is automatically generated based on these labels.
The network layout is automatically computed using NetworkX’s spring layout algorithm.
3. Adding an Interactive Parameter Panel
Use
self.params_manager.add_param(...)to register interactive parameters. The example adds threeFloatParaminstances for:initial_infected_percentageinfection_probrecovery_prob
Each parameter requires a
getterto read its current value from theScenarioand asetterto write the new value from the web UI back to theScenario.After changing a parameter in the UI, click the Reset button to restart the simulation with the new settings.
Visualizer: Code
This section shows the key code additions for the visualizer. Core logic files are the same as the covid_contagion_network example.
Visualizer Definition
This file is the core addition. It maps model data to visual elements. Defined in core/visualizer.py.
 1from Melodie import Visualizer
 2from .model import CovidModel
 3from MelodieInfra.lowcode.params import FloatParam
 4
 5
 6class CovidVisualizer(Visualizer):
 7    model: CovidModel
 8
 9    def setup(self):
10        # Add interactive parameters to the left control panel
11        self.params_manager.add_param(
12            FloatParam(
13                name="initial_infected_percentage",
14                value_range=(0.0, 1.0),
15                step=0.01,
16                getter=lambda scenario: scenario.initial_infected_percentage,
17                setter=lambda scenario, val: setattr(
18                    scenario, "initial_infected_percentage", val
19                ),
20                label="Initial infected %",
21                description="Share of agents initially infected (0-1).",
22            )
23        )
24        self.params_manager.add_param(
25            FloatParam(
26                name="infection_prob",
27                value_range=(0.0, 1.0),
28                step=0.01,
29                getter=lambda scenario: scenario.infection_prob,
30                setter=lambda scenario, val: setattr(
31                    scenario, "infection_prob", val
32                ),
33                label="Infection prob",
34                description="Probability an infected agent infects a neighbor each step.",
35            )
36        )
37        self.params_manager.add_param(
38            FloatParam(
39                name="recovery_prob",
40                value_range=(0.0, 1.0),
41                step=0.01,
42                getter=lambda scenario: scenario.recovery_prob,
43                setter=lambda scenario, val: setattr(
44                    scenario, "recovery_prob", val
45                ),
46                label="Recovery prob",
47                description="Probability an infected agent recovers each step.",
48            )
49        )
50
51        # Configure the chart to show population health states over time
52        self.plot_charts.add_line_chart("health_state_trend") \
53            .set_data_source({
54                "Susceptible": lambda: self.model.environment.num_susceptible,
55                "Infected": lambda: self.model.environment.num_infected,
56                "Recovered": lambda: self.model.environment.num_recovered
57            })
58
59        # Configure the network visualization
60        self.add_network(
61            name="covid_network",
62            network_getter=lambda: self.model.network,
63            var_getter=lambda agent: agent.health_state,
64            var_style={
65                0: {"label": "Susceptible", "color": "#0000FF"},
66                1: {"label": "Infected", "color": "#FF0000"},
67                2: {"label": "Recovered", "color": "#808080"}
68            },
69        )
Model Structure
Same as the network example. Defined in core/model.py.
 1from typing import TYPE_CHECKING
 2
 3from Melodie import Model
 4
 5from .agent import CovidAgent
 6from .data_collector import CovidDataCollector
 7from .environment import CovidEnvironment
 8from .scenario import CovidScenario
 9
10if TYPE_CHECKING:
11    from Melodie import AgentList
12
13
14class CovidModel(Model):
15    """
16    Network contagion model with visualization support.
17    Demonstrates the use of `Melodie.Network` for agent interaction,
18    combined with the Visualizer module.
19    """
20
21    scenario: "CovidScenario"
22    agents: "AgentList[CovidAgent]"
23    environment: CovidEnvironment
24    data_collector: CovidDataCollector
25
26    def create(self) -> None:
27        """
28        Create model components: Agents, Environment, DataCollector, and Network.
29        """
30        self.agents = self.create_agent_list(CovidAgent)
31        self.environment = self.create_environment(CovidEnvironment)
32        self.data_collector = self.create_data_collector(CovidDataCollector)
33
34        # Create an empty network structure
35        self.network = self.create_network()
36
37    def setup(self) -> None:
38        """
39        Setup model components and build the network.
40        """
41        # 1. Initialize agents
42        self.agents.setup_agents(self.scenario.agent_num)
43
44        # 2. Build network connections based on scenario parameters
45        # This uses NetworkX generators under the hood.
46        self.network.setup_agent_connections(
47            agent_lists=[self.agents],
48            network_type=self.scenario.network_type,
49            network_params=self.scenario.get_network_params(),
50        )
51
52        # 3. Seed initial infections
53        self.environment.seed_infection(self.agents)
54
55        # 4. Initial population stats for visualization
56        self.environment.update_population_stats(self.agents)
57
58    def run(self) -> None:
59        """
60        Main simulation loop.
61        """
62        for t in self.iterator(self.scenario.period_num):
63            self.environment.spread_on_network(self.agents)
64            self.environment.recover(self.agents)
65            self.environment.update_population_stats(self.agents)
66            self.data_collector.collect(t)
67        self.data_collector.save()
Environment Logic
Same as the network example. Defined in core/environment.py.
 1from Melodie import Environment
 2from typing import TYPE_CHECKING
 3import random
 4
 5if TYPE_CHECKING:
 6    from Melodie import AgentList
 7    from .agent import CovidAgent
 8    from .scenario import CovidScenario
 9
10
11class CovidEnvironment(Environment):
12    """
13    Environment handles infection/recovery logic on the network structure.
14    """
15
16    scenario: "CovidScenario"
17
18    def setup(self):
19        """
20        Initialize macro-level statistical counters.
21        """
22        self.num_susceptible = 0
23        self.num_infected = 0
24        self.num_recovered = 0
25
26    def seed_infection(self, agents: "AgentList[CovidAgent]"):
27        """
28        Initial seeding of infection among agents.
29        """
30        for agent in agents:
31            agent.seed_infection(self.scenario.initial_infected_percentage)
32
33    def spread_on_network(self, agents: "AgentList[CovidAgent]"):
34        """
35        Network-based infection logic:
36        1. Iterate through all infected agents.
37        2. Find their neighbors in the network.
38        3. If a neighbor is susceptible, infect them with probability `infection_prob`.
39        """
40        newly_infected = []
41        for agent in agents:
42            # Only infected agents can spread the virus
43            if agent.health_state != 1:
44                continue
45
46            # Get neighbors from the network structure
47            neighbors = self.model.network.get_neighbors(agent)
48
49            for category, neighbor_id in neighbors:
50                # Retrieve the actual agent object using category and ID
51                neighbor = self.model.network.agent_categories[category].get_agent(neighbor_id)
52
53                # Infect susceptible neighbors
54                if neighbor.health_state == 0:
55                    if random.random() < self.scenario.infection_prob:
56                        newly_infected.append(neighbor)
57
58        # Update states after iterating to avoid chain reactions in a single step
59        for agent in newly_infected:
60            agent.health_state = 1
61
62    def recover(self, agents: "AgentList[CovidAgent]"):
63        """
64        Infected agents recover with a certain probability.
65        """
66        for agent in agents:
67            if agent.health_state == 1 and random.random() < self.scenario.recovery_prob:
68                agent.health_state = 2
69
70    def update_population_stats(self, agents: "AgentList[CovidAgent]"):
71        """
72        Update statistical counts for the current step.
73        """
74        self.num_susceptible = 0
75        self.num_infected = 0
76        self.num_recovered = 0
77        for agent in agents:
78            if agent.health_state == 0:
79                self.num_susceptible += 1
80            elif agent.health_state == 1:
81                self.num_infected += 1
82            else:
83                self.num_recovered += 1
Agent Behavior
Same as the network example. Defined in core/agent.py.
 1from Melodie import NetworkAgent
 2from typing import TYPE_CHECKING
 3import random
 4
 5if TYPE_CHECKING:
 6    from Melodie import AgentList
 7
 8
 9class CovidAgent(NetworkAgent):
10    """
11    Network-based Covid agent with basic SIR states.
12
13    Attributes:
14        health_state (int): 0=Susceptible, 1=Infected, 2=Recovered.
15        category (int): Agent category (0 for all agents in this simple model).
16    """
17
18    def setup(self):
19        """
20        Initialize agent properties.
21        """
22        self.health_state: int = 0
23        self.category: int = 0
24
25    def set_category(self):
26        """
27        Required by NetworkAgent to determine the category ID.
28        We use a single category (0) for simplicity.
29        """
30        self.category = 0
31
32    def seed_infection(self, initial_infected_percentage: float):
33        """
34        Randomly infect the agent based on the initial percentage.
35        """
36        if random.random() < initial_infected_percentage:
37            self.health_state = 1